
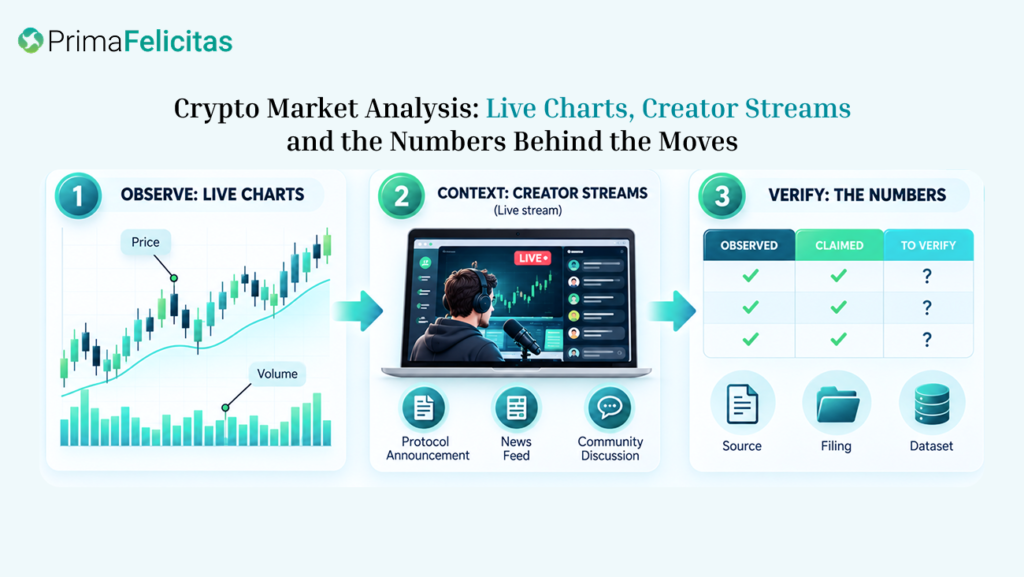
Useful crypto market analysis begins with a specific market event and asks what can actually be shown. A chart supplies the movement, volume and breadth add context, and a dated source may explain why attention changed. Commentary can suggest a mechanism, but it cannot turn a guess into a fact. The aim is a traceable chain from observation to interpretation, with the remaining uncertainty left on the page.
What Useful Market Analysis Should Answer
Start with a question small enough to test. You might be explaining an intraday reversal, comparing two sectors, assessing a broad selloff, or asking why one asset moved more than its peers. Each task needs its own window and comparison set. If the chart is selected only after the move, the pattern can look inevitable; define the period first.
Keep three sentences in mind: what happened, what might explain it, and what could happen next. “The price moved between these levels during the selected interval” is an observation. “Participants bought after a policy announcement” is an interpretation that needs a dated source and a plausible transmission path. “The trend will continue” is a forecast and carries a different level of uncertainty. Separating the sentences prevents a commentator’s explanation from being mistaken for the chart itself.
Reference price matters as much as the shape of the candle. A chart may use the last trade, bid, ask, midpoint, index, or mark price. Spot and derivatives screens can look almost identical while describing different markets. If the definitions are not matched, a difference between two charts may be a data convention rather than a new market event.
Start With the Chart, Then Add the Context
The crypto market analysis section can help readers find live commentary and market-focused discussion. Treat a stream as a place to collect hypotheses. Note the chart interval, asset pair, price type, and whether the speaker is describing a completed move or anticipating one. Fast delivery often gives a tentative idea more confidence than the evidence warrants.
Keep the chart check modest. Compare the selected interval with one broader and one narrower view, then inspect volume, range, gaps, and the venues showing the move. A pattern that looks decisive on a five-minute chart may vanish on a daily chart. The point is not to hunt for a perfect indicator; it is to see which observations survive a change in scale.
Market breadth adds perspective. If one asset rises while most close peers fall, the move may be specific to that project. If several sectors advance with active turnover, broad participation becomes more plausible, though continuation is still unknown. Count-based breadth can be distorted by many small assets, so add market-cap weight and volume when the data allow.
The cryptocurrency prices chart can provide a market-wide reference for current quotes and relative movement. Match timestamps and quote currencies before placing it beside a stream. An aggregate quote, a single-venue trade, and a derivatives mark can all differ for legitimate reasons. Name the reference you used instead of presenting one screen as the market’s universal price.
What Creator Streams Add—and What They Cannot Prove
Live discussion adds chronology and lets competing interpretations appear in the same place. A creator might point to a filing, protocol announcement, or chart formation while viewers ask questions that expose a missing assumption. That is valuable for discovery. The format becomes unreliable when speed replaces attribution, a repeated claim is counted as independent confirmation, or a confident personality stands in for a source.
Look at how the stream handles information. Does the host show the original document, give its publication time, and label opinion as opinion? Are sponsorships, holdings, and referral relationships disclosed? Can a viewer replay the segment and find the underlying data? Those checks do not prove that a conclusion is correct; they reveal whether someone else can audit it.
The watch crypto live page can suit readers who want to follow a discussion while checking charts themselves. Keep the broadcast inside a wider process. A live room may surface a lead quickly, yet omit jurisdictional detail, revise its view as evidence arrives, or amplify a rumor before a primary source is available.
Three columns are enough for most notes: “observed,” “claimed,” and “to verify.” Put the displayed price and timestamp in the first, the host’s explanation in the second, and the announcement, filing, or dataset needed for confirmation in the third. The format keeps the screen event separate from the proposed cause.
A Repeatable Analysis Workflow
Before publishing or acting on a market narrative, work through this sequence:
- State the question. Define the asset, comparison group, time window, and decision the analysis is meant to inform.
- Capture the raw view. Save chart interval, price type, quote currency, volume, timestamp, and relevant market breadth.
- List plausible explanations. Include at least one non-news explanation, such as liquidity, positioning, or a reference-price change.
- Check primary sources. Prefer an official release, filing, technical notice, or dated record to a repost or clipped video.
- Compare independent markets. Look for confirmation across relevant venues, pairs, and timeframes without assuming every feed must match exactly.
- Mark uncertainty. Label what is confirmed, probable, disputed, or unknown at the time of writing.
- Update responsibly. If new evidence changes the explanation, correct the claim and preserve the original timestamped context.
Consider a hypothetical case. A token falls 8 percent in twenty minutes while a creator says a listing is being removed. The chart confirms the fall, not the explanation. Check the exchange notice, compare the token with its sector, inspect volume and spreads, and establish whether the rumor appeared before or after the move. If no notice can be found, say that a claim circulated; do not write that delisting caused the fall.
For longer pieces, keep a source log with the URL, publication time, access time, relevant quotation or field, and primary-or-secondary status. This matters when a page changes or a stream is edited later. It lets readers distinguish a transparent update from a story reconstructed with hindsight.
Test the narrative against a counterfactual
One way to reduce confirmation bias is to ask what the chart would look like if the proposed explanation were wrong. If a listing announcement supposedly caused a move, look for comparable action in the relevant venue and pair, then establish whether the announcement was public before the price changed. If the explanation is macro, compare several assets that should share the exposure. A counterfactual does not prove a cause, but it can expose a story that fits one convenient chart and nothing else.
Timing is different from correlation. A post published after a rally may describe it accurately without explaining it. The author could have observed the same chart as the audience rather than supplied information that moved the market. Record publication time, trade time, and source time to see whether the proposed information was available early enough to matter.
When a stream changes its view, preserve the revision. A correction can increase credibility when the host explains which new evidence changed the conclusion. Quietly deleting the earlier claim removes context and makes the discussion difficult to audit. For journalists, a short note describing what changed and why is clearer than silently replacing the original paragraph.
The finished article should show its evidence boundary. List what was observed directly, the interpretation supported by those observations, and the questions still open. Readers can then update the analysis when the market or source record changes, instead of treating a directional label as a permanent answer.
Limits, Risks, and a Restrained Conclusion
Charts may be delayed, incomplete, or distorted by thin liquidity. Streams can contain errors, conflicts of interest, or content unavailable in a reader’s region. A plausible narrative may still be untestable, and a well-supported explanation cannot predict the next price. Fees, taxes, leverage, custody, and local rules add decisions that a general media article cannot settle for everyone.
The most reliable conclusion is procedural. Start with the chart, add breadth and volume, use commentary to find questions, and check important claims against dated primary material. Good analysis shows its assumptions and failure cases. Its job is to improve a reader’s judgment, not to outsource that judgment to a host, an indicator, or a live feed.
FAQ
Is a live stream a reliable source of market information?
It can be a useful discovery source, but reliability depends on attribution, timing, disclosures, and independent verification. Treat commentary as analysis until the underlying claim is checked.
Which chart timeframe should I use?
Use the timeframe that matches the question, then compare it with at least one broader and one narrower view. A single interval can hide reversals or make noise look like a trend.
Does high volume confirm a bullish or bearish signal?
No. Volume shows recorded activity, not a guaranteed direction or future outcome. Interpret it with price structure, liquidity, breadth, and the event being studied.
How should I handle an unverified breaking-news claim?
Label it as unverified, search for the original source, and avoid assigning causality until the evidence is available. Preserve the publication time because later confirmation does not prove the earlier claim was known.
Can technical analysis explain every market move?
No. Charts describe market behavior and can support scenarios, but they do not reveal every fundamental, operational, or regulatory cause. Keep the limits visible.
Turn live market chatter into evidence-backed analysis—separate observations, claims, and verification to understand crypto moves with clarity. Contact PrimaFelicitas to build transparent, data-driven market intelligence tools.
