
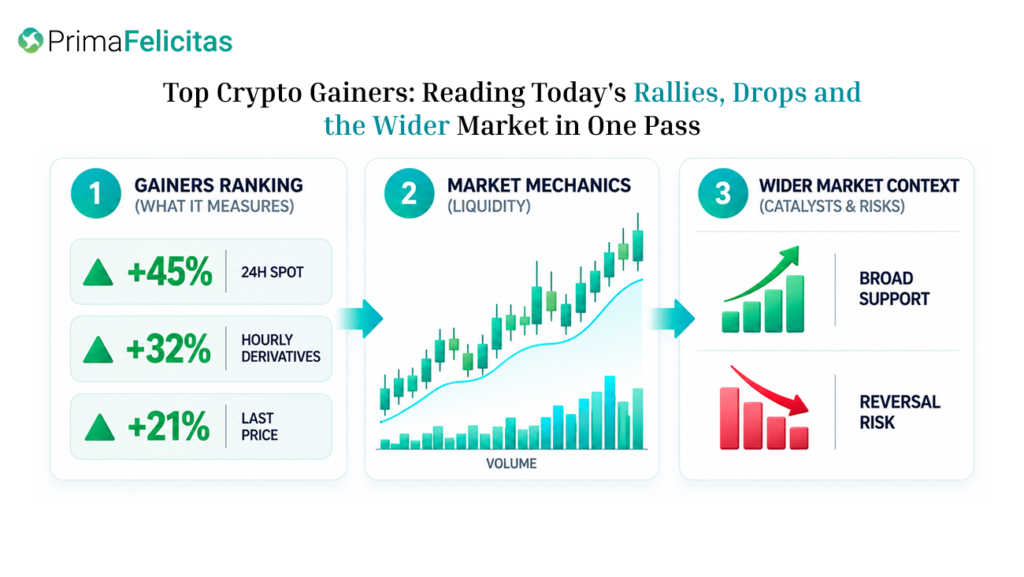
The Top crypto gainers list is useful for finding what deserves investigation, but it is not a self-explanatory market signal. It tells you which assets posted the largest percentage moves under a particular rule and time window. It does not tell you whether the move was liquid, broadly supported, news-driven, or already fading. A sound reading therefore starts with the definition of the list, then tests the move against volume, breadth, opposing performance, and a verifiable explanation.
What a Gainers Ranking Actually Measures
A leaderboard is a measurement device, not a verdict. Before interpreting a row, record the interval, quote currency, market type, venue coverage, update time, and any minimum-volume or market-cap filter. A 24-hour spot ranking answers a different question from an hourly derivatives list, and a list based on the last traded price may not match one based on an index or mark price.
The denominator matters as much as the numerator. A token moving from $0.10 to $0.13 has a 30% change, while a liquid asset moving from $100 to $103 has a 3% change. The first move is larger in percentage terms; the second may represent more dollars traded and a more reliable executable market. Rank order alone cannot distinguish those cases.
A ranking can also change while the underlying story stays the same. If the dashboard refreshes continuously, a new listing, a late trade, or a reversal near the cutoff can move an asset several places. Save the timestamp and the displayed fields before making a comparison. That simple record prevents a later screenshot from being mistaken for a permanent classification.
Read the Percentage Move With Its Market Mechanics
Percentage return is the headline field, but liquidity determines whether the headline can be acted on at a similar price. Check the bid-ask spread, visible depth near the quote, turnover, and the number of venues or pairs represented. A large move in a shallow book may be genuine yet difficult to enter or exit without materially changing the price.
Volume is a useful cross-check, not proof of demand. Turnover can include market making, arbitrage, liquidation prints, or repeated activity in one pair. A rise accompanied by expanding activity across several liquid pairs is more consistent with broad participation than a rise concentrated in one thin venue, but neither pattern guarantees continuation.
| Observed pattern | What it may indicate | What to verify next |
|---|---|---|
| One small token up sharply | A low-base effect or thin-book repricing | Spread, depth, pair coverage, and the exact prior close |
| Several liquid assets rise together | Broader risk appetite or sector rotation | Breadth, benchmark performance, and sustained turnover |
| A spike followed by instant retracement | A squeeze, liquidation cascade, or short-lived headline | Candles around the timestamp and an original source |
| High volume but little price progress | Two-sided trading or absorption near a level | Order-book changes and whether volume is spot or derivatives |
The table is a reading aid rather than a scoring system. Its purpose is to force a second observation before a strong label such as “rally” or “breakout” is applied. In a volatile market, the quality of the measurement often matters more than the rank itself.
Use Losers and Breadth to Test the Story
A winners list becomes more informative when paired with a crypto price drop view. Look at the count of advancing and declining assets, the size of the largest movers, and whether weakness is concentrated in one sector. If gaming tokens rise while infrastructure tokens fall, a single “crypto is up” label hides a rotation. If both sides are dominated by small assets, the apparent direction may simply be noise.
The broader crypto market provides a baseline for that comparison. An asset can rank first while major assets are flat, and that is not a contradiction; it means the move may be idiosyncratic. Conversely, if the leaders, sector peers, and major benchmarks move together, market-wide exposure is a more plausible part of the explanation. Correlation still does not establish cause, so the chart must be paired with source evidence.
Breadth should be read in more than one way. Counting tokens gives each asset equal weight, while a market-cap-weighted view gives larger assets more influence. Traded value adds another perspective. A market can have many gainers by count but still lose value in its largest constituents, or show a few large-cap advances against a long list of small declines. State which measure you used before drawing a conclusion.
Event timing is another guardrail. A listing notice, token unlock, governance vote, partnership claim, or exchange maintenance message can affect price, but a social post is not proof that the underlying event occurred. Check the project’s own notice, a venue announcement, or a dated filing where available. Treat the catalyst as unconfirmed when the primary record cannot be found.
A Reproducible Audit for Today’s List
The following routine is designed for a reader who wants to explain a ranking to someone else later. It is deliberately slower than scanning the first green row, but it creates an audit trail that can be checked when the order changes.
- Freeze the snapshot. Write down the date, time zone, update time, interval, quote currency, and whether the list covers spot, margin, or derivatives markets.
- Identify the instrument. Confirm the token symbol, pair, venue coverage, and listing age. Newly listed or thinly traded instruments need a higher bar for interpretation.
- Measure the move beyond rank. Record percentage change, absolute change, high-low range, spread, visible depth, and turnover. If a field is missing, mark the limitation rather than filling it with an assumption.
- Test participation. Compare the leader with sector peers, major assets, and both count-based and market-cap-weighted breadth. This separates a single-asset jump from a market-wide repricing.
- Check the opposing side. Review declines and volume concentration. Ask whether capital appears to be entering the market or rotating from one group to another.
- Verify and challenge the explanation. Locate a dated primary source, then write one alternative such as profit-taking, a forced liquidation, a data anomaly, or insufficient depth. Keep both the evidence and the uncertainty in the record.
An illustrative comparison shows why this matters. Suppose Asset A is up 28% on a single small pair, while Asset B is up 5% across several liquid pairs with steady turnover. Asset A deserves attention because the percentage is unusual; Asset B may be the stronger evidence of broad participation. The ranking alone cannot choose between those interpretations.
This process is research hygiene, not a buy or sell instruction. It can help a journalist find a lead, an analyst test a hypothesis, or a cautious participant decide which data needs deeper review. The conclusion should match the evidence actually recorded, not the confidence suggested by a colored badge.
Limits, Risks, and Appropriate Use
Ranking pages can rely on different data vendors, refresh schedules, and venue samples. Figures may be delayed, estimated, or affected by a temporary outage. A high return can coexist with poor execution, wide spreads, leverage-driven liquidation, or a withdrawal restriction that the leaderboard does not display. Local rules and product terms also determine what a reader can access.
The same list therefore supports different legitimate uses. A reporter may use it to locate a possible story; a researcher may compare the definition with another data source; a market participant may use it only to decide what deserves verification. None of these uses makes the ranking a forecast, and a review should be repeated when the time window, venue, or reader’s objective changes.
Do not infer quality from a single green number, a polished dashboard, or a dramatic social explanation. If the data cannot be reproduced, label the result as provisional. Where significant funds, leverage, or jurisdiction-specific obligations are involved, readers should consider qualified professional advice.
Conclusion
Top crypto gainers are valuable because they focus attention, not because they settle the question of what is happening. A reliable reading identifies the ranking rule, checks liquidity and volume, compares winners with losers, tests breadth against the wider market, and verifies the proposed catalyst. That sequence turns a fast-moving leaderboard into a transparent research prompt while keeping its limits visible.
FAQ
Does first place mean an asset is the strongest?
No. It means the asset recorded the largest move under that list’s rules during the selected interval. Strength requires additional evidence such as usable liquidity, participation beyond one pair, persistence, and a credible explanation.
Why can a token disappear from the list within minutes?
The ranking is dynamic. A short observation window, a reversal, a new listing, or a late trade can change the order quickly. Record the timestamp before comparing two snapshots.
Are small-cap gainers always unreliable?
No, but they require stricter checks. Small assets can reveal emerging activity while also carrying wider spreads, thinner depth, greater data sensitivity, and more pronounced base effects.
